[This post is evolving. Please contribute via comments with questions and insights.]
There are many ways to determine the effectiveness of a CUAS. A common approach is to visually compare a ground truth source such as a TSPI puck on the UAS target to the CUAS track of that target. When using a vendor’s user interface this is relatively straightforward. However when comparing multiple vendors a common frame of reference is required and the situation gets complicated.
Position information:
First, let’s look at how the position data is presented by a representative TSPI (time, space, position information) device and some pseudo-vendors.
TSPI device – Lat, Lon, Altitude
- Lat, Lon in degrees (standard values)
- Altitude in meters with origin at ‘Mean Sea Level’
- accurate to within 1 meter in all directions
Vendor 1 – Lat, Lon, Altitude
- Lat, Lon in degrees (standard values)
- Altitude in meters with origin at ‘height above drone launch point’
Vendor 2 – Lat, Lon, Altitude
- Lat, Lon in degrees
- Altitude in meters with origin at ‘height above sensor location’
Vendor 3 – Azimuth, Elevation, Range
- Origin at sensor location
- Azimuth in degrees with 0 at true north, range from 0 to 360 clockwise
- Elevation in degrees with 0 at tangent to the plane of the earth surfaces, range 90 to -90, 90 is straight up, -90 straight down
- Range in meters, range 0 to infinity
Vendor 4 – Azimuth, Elevation
- Origin at sensor location
- Azimuth in degrees with 0 at true north, range from 0 to 360 clockwise
- Elevation in degrees with 0 at tangent to the plane of the earth surfaces, range 90 to -90, 90 is straight up, -90 straight down
What coordinate system to use?
As you can see from the definitions of the different vendors and ground truth, none are working in the same coordinate system. To compare tracks we first need to determine a common coordinate system. The coordinate system that makes the most sense to use when we are given three spatial dimensional values is that of the TSPI device – Latitude, Longitude and Altitude above mean sea level (LLA). This is a well understood representation of position data and many tools exist for working with or converting to/from LLA.
In the case of vendor 1 the origin is actually specific to the tracked objects launch point. In many cases this launch point is not known (we’ll talk more about the implications of this situation and how to deal with it later).
For vendors 2, 3, and 4 we must know the sensor’s location and that information must accompany the data produced by the sensor to be useful in later analysis.
In the case of vendor 4 we only have two spatial dimensions to work with instead of three like the others, this makes a straightforward comparison to the other vendors difficult, because we can’t convert into LLA, but not impossible.
Vendor 1 Idiosyncrasies
Using ‘height above drone launch point’ comes with some issues that are best shown using graphs.
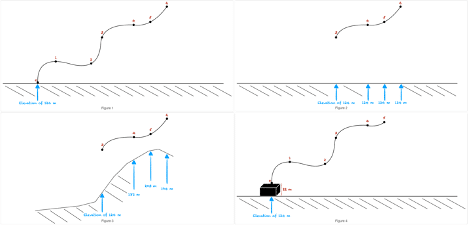
As you can see in the above figures we are looking at the same flight track. In figure 1 we were able to track the drone from the time it took off, giving us the launch point’s altitude and allowing us to reliably adjust the rest of the track into Altitude values. In figure 2 we weren’t able to track the drone from its launch point so we don’t have a starting altitude to use to adjust the track. If we make the assumption that the area the drone flies over is both flat and at the same height as the launch point then we can somewhat reliable use the elevation values under the drone along its flight path to make the altitude adjustments. Unfortunately, as you can see in figure 3, if the flight takes place over uneven surfaces and we don’t have the launch point altitude then we can’t reliably make altitude values. In figure 4 while we have the launch point of the drone and there for can get the elevation value just like in figure 1; unfortunately the drone was launched from a 22 meter tall building so will be off by 22 meters, unless we are somehow given that building height correction we again can’t reliably make altitude values.
Vendor 2 Idiosyncrasies
Using ‘height above sensor location’ ends up being much easier to convert to Altitude.
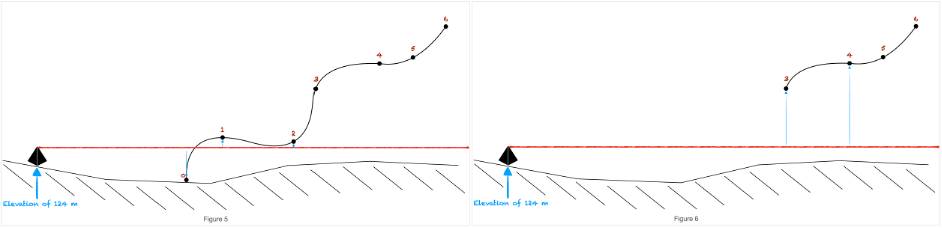
As you can see in the above figures converting vendor 2’s ‘height’ data into Altitude can be done successfully when we know or can find the altitude/elevation of the sensor. This method of reporting height of a drone allows the correct altitude to be derived even when we don’t know the launch point of the drone, and even when the flight takes place over uneven terrain.
Vendor 3 Idiosyncrasies
For Vendor 3 we are given Azimuth, Elevation and Range. The conversion of these values is straight forward as long as we have a precise location for the sensor. There are a few ways to convert LLA with varying levels of required computation. The most accurate, and most computationally expensive although it can still be done in real time, is to convert to Earth Centered Earth Fixed (ECEF) and then to LLA.
Vendor 4 Idiosyncrasies
Vendor 4 gives us Azimuth and Elevation only. The issue is that without a Range value we can’t convert to LLA, ECEF or any coordinate system that has 3 spatial dimensions. This makes comparisons to other vendors much less straight forward, but there are still ways to accomplish this.
Ways of Comparing Vendors
For vendors that give us three spatial dimensions, LLA(even if the A isn’t really an A) or EAR the most straight forward way to compare the vendors to the ground truth data in three dimensions using LLA values by either converting to LLA or using it if given.
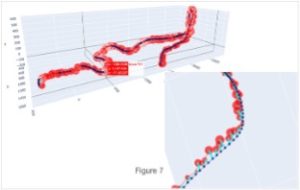
In figure 7 above we see the ground truth data in dark blue and the vendor data in red. The cyan colored lines represent the error in meters (both direction and magnitude) and the red dots are proportional to the error between the ground truth and the vendor. This type of visualization allows you to quickly get an overall idea of how the vendor is performing as well as zero in on certain trouble spots during the flight. This is not without issues however, the most glaring is that this doesn’t take into account the distance that the vendors sensor is to the ground truth drone track. The assumption being that the closer sensor is to the drone at detection time the more accurate it will be.
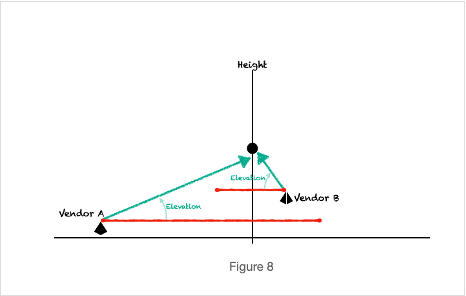
To illustrate this point we have the following graph. Both vendors track the drone using EAR, and as you can see Vendor B is currently tracking the drone more accurately than Vendor A. However Vendor A is much further away from the drone. Determining tracking accuracy should take into account other factors such as distance from the sensor.
To combat this we can perform the analysis illustrated in figure 9 below and then create the graph we see in figure 10.
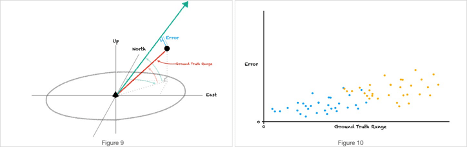
The analysis we perform is to create EAR data for the ground truth data for each vendor sensors location. In figure 9 we can see the two values that we are after. The first is the ‘Ground Truth Range’ which tells us how far away the drone truly is from the sensor and the ‘Error’ between where the drone truly is and where the sensor thinks it is. In figure 10 we see that, as an example, when data from the blue vendor is compared to data from the orange vendor, the blue vendor was closer to the drone and as we might expect has a lower over all error rate than the orange vendor that is farther away. However, we can see that when factoring in the ‘ground truth range’ the two vendors appear to be performing equally as well.
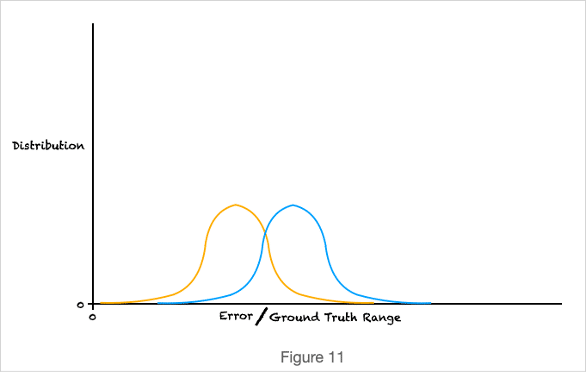
We can take this type of analysis further though. If we look at the ratio of the ‘error’ over ‘ground truth range’ we can do a few useful things. In figure 11 we see the distribution of the ratio for both vendors. And lo and behold turns out even though the blue vendor was further away from the drone it has a smaller ‘error’ to ‘ground truth range’ value.
Another thing that can be useful to do with the ‘error’ to ‘ground truth range’ data is to replace the ‘error’ we used in figure 7 with our ‘error’ to ‘ground truth range’; this allows us to factor in the distance that the vendor sensor is from the drone in our 3d visualization.
Up to this point we haven’t not talk about how to handle the 2d data we received from Vendor 4. So far our analysis has required three spatial dimensions. Turns out that if you take a look at figure 9 above, the green line doesn’t have to actually have a range value. This means that we can have the green line go to infinity and then calculate that ‘error’ value for our vendor 4 with 2d data and then be able to compare that to our other vendors that have 3d data in a very useful and truthful way.
Conclusion
There are a number of steps that have to be taken to compare different vendors to ground truth and each other. But it can be done in an automated and defensible manner.
References
This is a great paper by Skyhook entitled Best Practices to Measure Location Accuracy and Key Performance Metrics.