Airspace Awareness Platform Reports
The Airspace Awareness Platform provides 33 standard charts with new ones arriving every month. The initial charts were designed by Dr. Ryan Wallace, Associate Professor, Embry-Riddle Aeronautical University. The descriptive questions are drawn from the requirements document for the initial implementation of the platform under the ASSURE program.
Every question is answered with a presentation ready chart and accompanying CSV file containing the raw data used to build the chart.
Topic: sUAS Traffic within the National Airspace System
-
What are current sUAS traffic attributes over urban areas (i.e., number of operations, flight altitudes, durations, classes of airspaces, & proximity to airports)
-
What are estimated registration rates for sUAS?
-
Where do sUAS fly and at what altitudes are they flying at?
-
Can rough estimates be made regarding sUAS retirement/abandonment rates?
-
Can public agency (eg. Police, fire, government) use of sUAS be estimated?
-
What percentage of the detected sUAS population weigh less than 0.55 lbs and is not required to be registered?
-
What are the potential impacts to implementing ADS-B (Out) for sUAS?
Topic: Compliance and Exceedances of 14 CFR 107 Operational Limitations
-
What are exceedance rates for Operations from a Moving Vehicle (14 CFR §107.25)?
-
What are exceedance rates for Daylight Operation (14 CFR §107.29)?
-
What are exceedance rates for Visual Line of Sight Aircraft Operations (14 CFR §107.31)?
-
What are exceedance rates for Operation Near Aircraft (14 CFR §107.37)?
-
What are exceedance rates for Operation Over Human Beings (14 CFR §107.39)?
-
What are exceedance rates for Operating Limitations for sUAS (14 CFR §107.51)?
Topic: Near Aerodrome sUAS Operations & Encounter Risks with Manned Air Traffic
-
What is the likelihood of encountering another sUAS during flight?
-
What is the likelihood of a low altitude manned aircraft encountering a sUAS during a flight?
-
How well are the 400-foot maximum altitude (14 CFR §107.51) rule and Low Altitude Authorization & Notification Capability (LAANC) altitudes (i.e. via UAS
-
Facilities Map [UASFM]) working for segregating sUAS operations from General Aviation (GA) aircraft and helicopters?
-
How many manned aircraft dip below UAS Facility Map altitudes when flying inside/outside terminal airspace?
-
How many sUAS fly above UAS Facility Map altitudes when flying inside terminal airspace?
-
Can “hotspots” be identified that indicate vulnerability to sUAS encounters?
-
Are sUAS hotspot locations predictive of UAS sighting report locations?
-
How many sUAS are flying inside no-fly zones?
-
How many sUAS are flying near critical infrastructure?
-
How far are remote pilots flying their drones (rates of BVLOS flight)?
Topic: Forecasting Industry Growth & Potential Advanced Air Mobility Implications
-
What are the likely impacts Urban Air Mobility (UAM) / Advanced Air Mobility (AAM)?
-
How can sUAS detection data be leveraged to improve safety and efficiency in Unmanned Traffic Management (UTM)?
-
How do air routes impact sUAS activity?
-
How can “abnormal sUAS traffic” conditions (i.e. volume and proximity) be conveyed to air traffic control (ATC), general aviation, helicopter, and manned aircraft pilots?
Examples
Altitude Distribution
Description: Displays a chart showing flights by maximum height (altitude or AGL) by year.
Interpretation: 81.2% of the flights were below the FAA-prescribed maximum height (AGL) of 400 feet. A slightly smaller percentage of flights (16.2% vs. 19.2%) were above the maximum height of 400 feet in 2022 than in 2021.
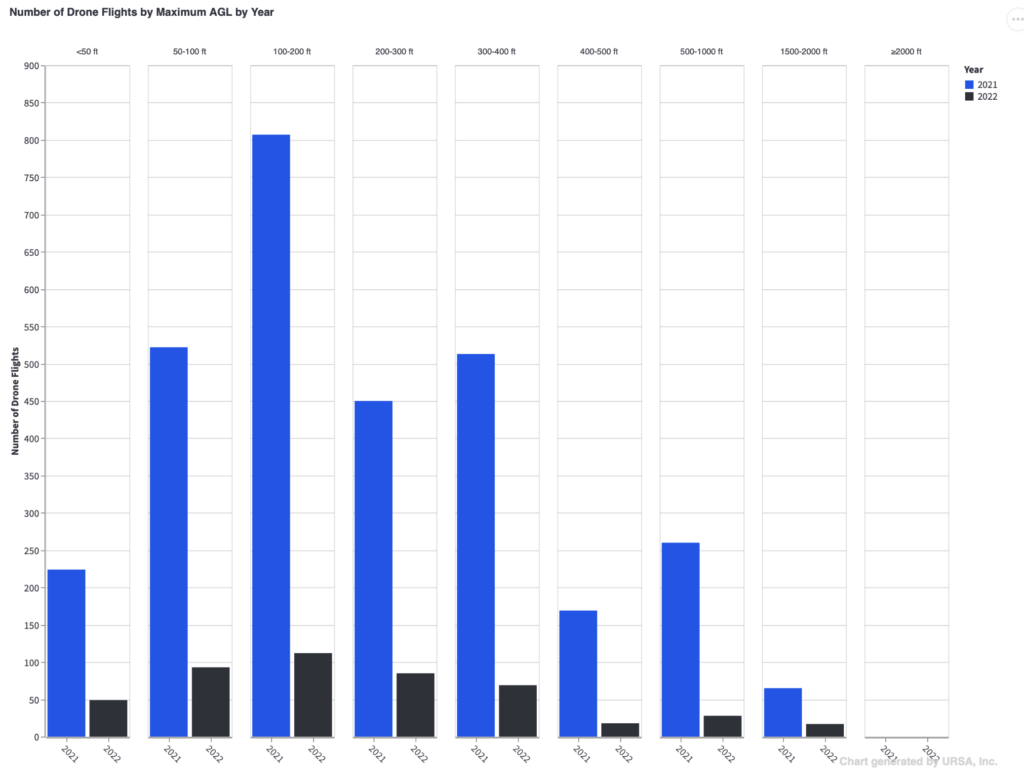
Number of Drone Flights by Maximum AGL by Year
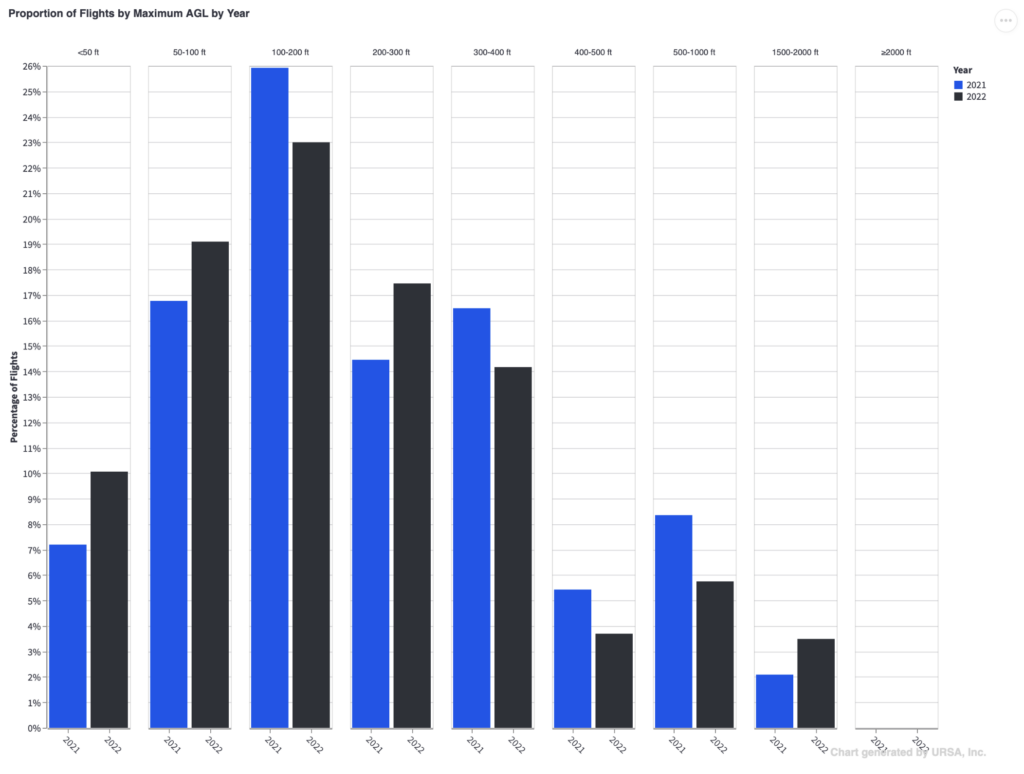
Proportion of Drone Flights by Maximum AGL by Year
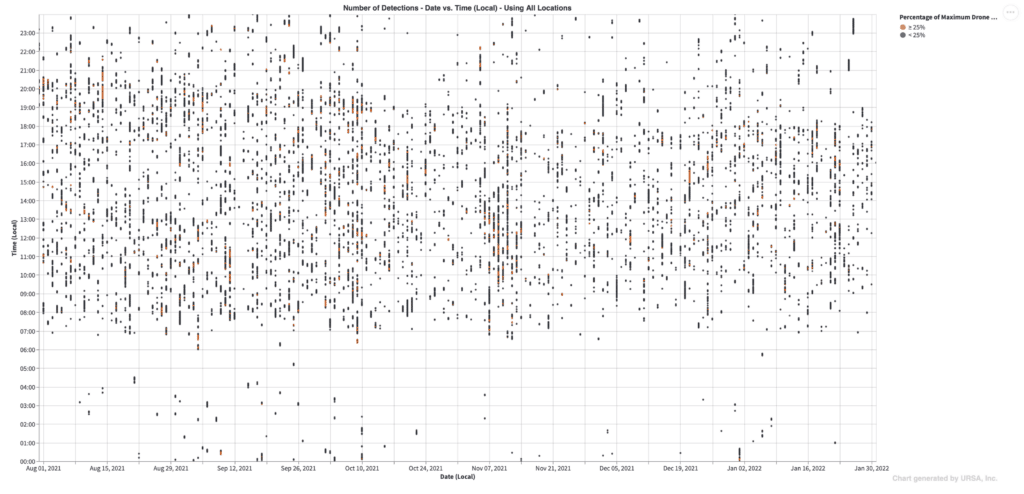
Detections by Date vs. Time
Description: Displays a scatterplot of the data showing date vs. time. Note that this chart only analyzes drone flights, not pilot or home locations.
Interpretation: The majority of flights occurred during the day and/or civil twilight. Of the flights occurring at night, most occurred between the end of civil twilight in the evening and midnight than occurred between midnight and the beginning of civil twilight in the morning.
Only one drone was flying during most date/times (with minute resolution). There was not any contiguous period during which multiple drones were flying (as might be seen, for example, in the evening of July 4).
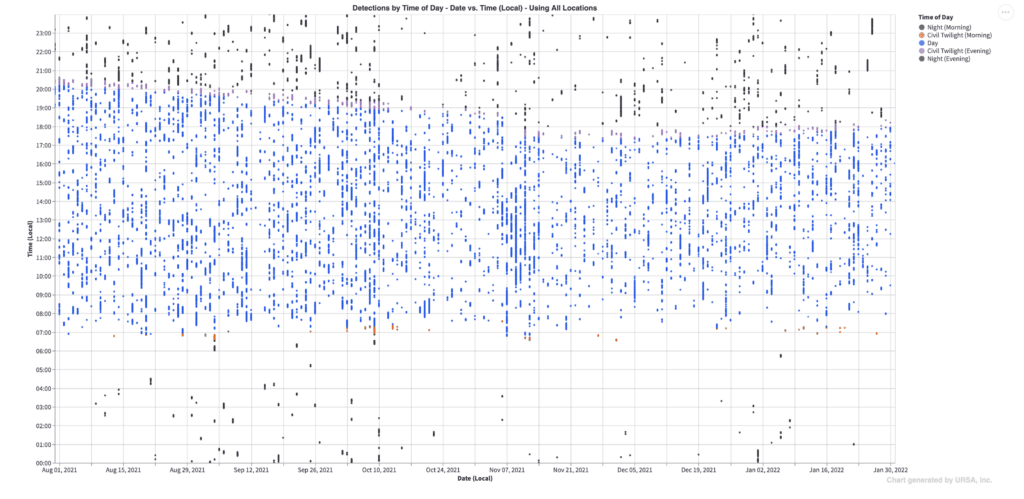
All Locations by Time of Day
