In the simplest terms we need to compare apples to apples. To accurately compare data from different sources that all relate to a common event – a UAS flight in this case – we must use common frames of reference. Before we dig into examples, let’s cover what is involved with “normalizing” data.
A definition to kick us off:
Normalizing – Simple and sophisticated adjustments intended to bring a variety of data into a common frame of reference.
At a bare minimum, all of your data should use the same timezone and reference model for the physical location of all participating systems.
Example: All times are converted to GMT and LLA (latitude, longitude, altitude) using WGS 84 and altitude in meters above sea level.
To normalize the source data, you should apply well understood transformations to convert the source format into the desired format. For example:
- Convert a local time to UTC in Python. (Similar functions exist for all major programming languages and for applications such as Excel and MATLAB)
utc_dt = local_dt.astimezone(pytz.utc) - Geodetic coordinates latitude , longitude , height can be converted into ECEF coordinates using the following equation: (There are solid implementations of this online and in most major programming languages, you do not need to do it by hand.)


Let’s walk through a chart showing some example source data, the forms it might take, how URSA normalizes it and the results.
| Field name | Examples | Processes Applied | URSA Field Name | URSA Significance | URSA Units | Interpolated? |
| timestamp | Date time, time since system start, epoch + different data formats | Taxonomy, Interpolation | timestamp | Time since epoch (Unix) | nanoseconds | Yes |
| timezone | Sensor’s, cloud instance’s, targets, GMT | Taxonomy, Interpolation | timezone | Timezone | GMT | Yes |
| target location | GPS (unknown accuracy), bearing/range (unknown zero) | Taxonomy, Interpolation | vehicle_position_latitude | GPS latitude | WGS 84 | Maybe |
| target location | GPS longitude | vehicle_position_longitude | GPS longitude | WGS 84 | Maybe | |
| altitude | AGL (m or ft), MSL (m or ft), Barometric, Above Launch | Taxonomy, Interpolation | vehicle_position_altitude | Above Ground Level | Meters | Yes |
| Velocity | Velocity (North, East), Velocity (x,y,z), airspeed (ground, true) | Taxonomy, Interpolation | vehicle_velocity_(x|y|z), vehicle_velocity_(ground|air), vehicle_velocity_(down|east|north) | Velocity | Meters / Second | Maybe |
Each row shows:
- A representative source field
- The information that field contains and some example units and reference models
- The process we apply to normalize the field
- The resulting field name for internal or API use
- The significance or reference model for the resulting field
- The units of measure
- If the field is interpolated or not. If we applied a conversion function, the data was interpolated. If we simply changed the units of measure – kilometers to meters for example – it was not
It is worth going through the exercise of creating this chart. It will help ensure that you understand your source data and it will help those that follow you understand what you did to the data to get it into the final form.
You can do all of your normalization using a combination of Excel and simple scripts. However, as for any complex rote tasks, encoding it in some formal manner will greatly reduce the level of effort required and reduce the possible ways for errors to creep into the process.
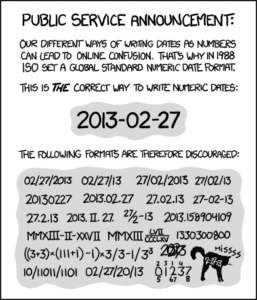
By the way, understanding and converting timestamps and timezones is so challenging and important that there are multiple XKCD cartoons about it. Here are two examples: